
Rules for Constructing Diagrams and Types of Diagrams
Rules for Constructing Diagrams and Types of Diagrams: Overview
This Topic covers sub-topics such as Bar Graphs, Pareto Diagram, Diagrams and Graphs, Structure of Pie Chart, A Double Bar Graph of Data, Percentage Change by Graphical Method and, Rules for Constructing Diagrams
Important Questions on Rules for Constructing Diagrams and Types of Diagrams
Following bar graph shows the ratio of export to import of two companies A and B during the period of 1990-1995.
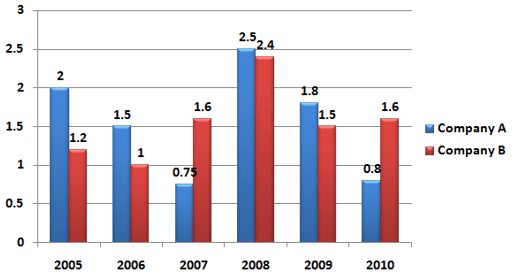
In which year, the difference of export and import for Company B is minimum?
Study the following graph carefully ---
Production of three different type of tyres by a company over the year (in Lakhs)
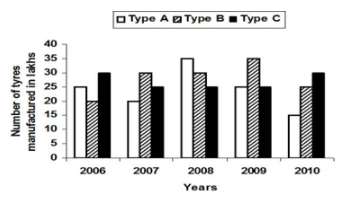
In and , what was the difference between the number of B-type tyres manufactured ?
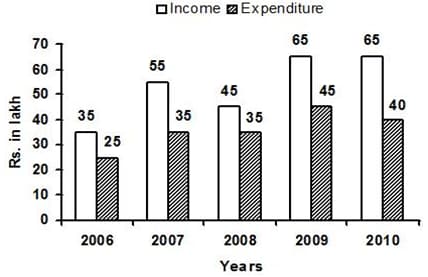
Study the data presented in the following graph to answer these questions.
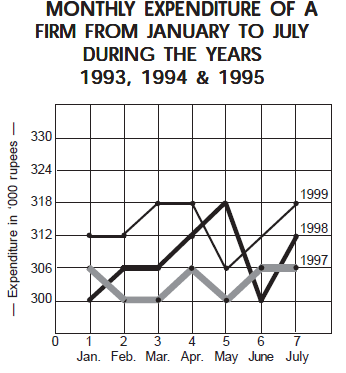
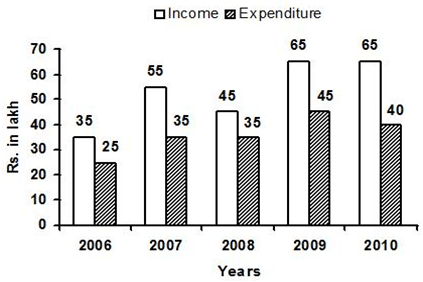
What is the total expenditure during the period under review ?
Directions— Study the following graph carefully to answer the questions— The following Bar graph gives the number of products manufactured and sold by a company over the years. to Value in
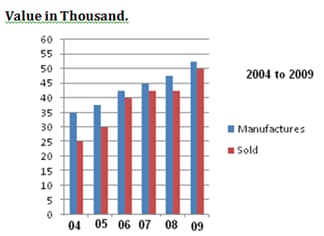
The number of products sold by the company in the year is what per cent of the number of products manufactured by it in that year ? (Rounded off to two digits after decimal)
Read the following graph carefully and answer the questions given below :
Marks obtained by five students in different languages
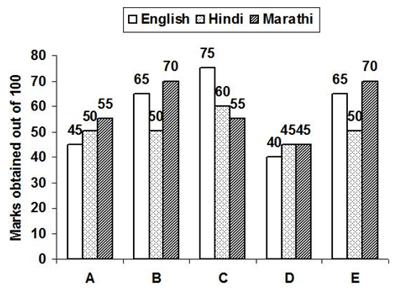
What is the respective ratio between the marks obtained by all students in Hindi and Marathi ?
Number of candidates who cleared different exams:
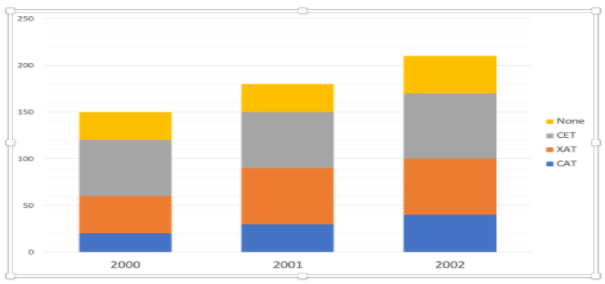
What was the percentage of students who cleared CAT in ?
Sales of Books (in ) from six branches -and of a publishing company in and Study the graph and answer the questions.
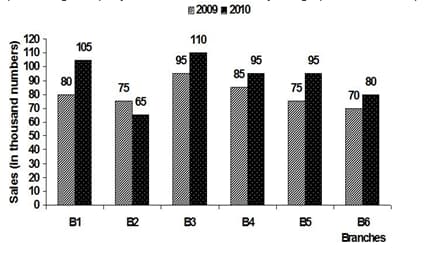
The average sales of all the branches for the year is equal to_____.
Study the following graph carefully and answer the questions-
The graph shows income and expenditure of a company
If % of the people who prefer Piano, would go with the people who perfer Flute, the percentage of people who prefer flute would have been.
Following bar graph shows the ratio of export to import of two companies A and B during the period of 1990-1995.
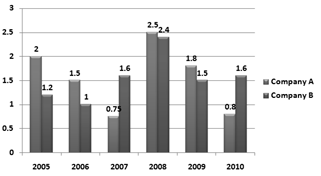
For Company A if in the year export is decreased by and import is increased by then what will be the new ratio between export and import?
Study the following graph and answer and answer question number on the top of a bar is the number of cars-
Demand and production of cars of five companies for January (in ) ;
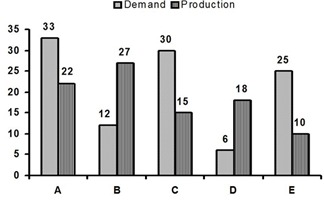
Demand of company is approximately what percent of demand of company ?
Study the following graph carefully and answer the questions-
The graph shows income and expenditure of a company
The number of people who prefer Guitar is greater than the total number of people who prefer either Flute or Piano by-
Read the following information and answer the given question.
Following graph provides data about total
milk production((in million litres) ) in different sectors 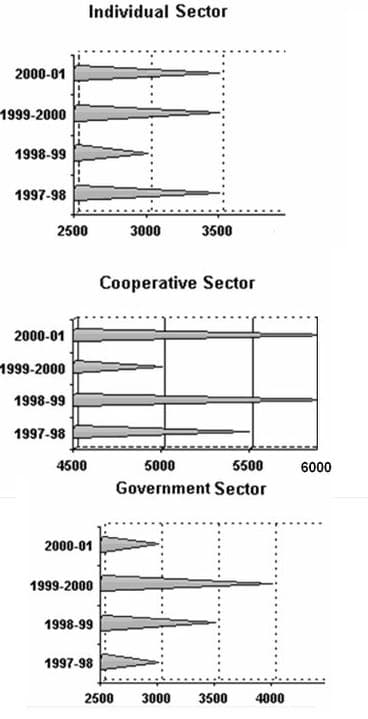
If the milk production in India from the year 2000-2001 to the year 2001-2002 increased at the rate of 5% in Individual sector, 5% in Cooperative sector and 10% in Government sector, then what is the difference in total milk production between 1999-2000 and 2001-2002 for the three sectors?
Bar diagram which shows the production of electronic equipment from to .
Production of Electronic Equipment (in millions)
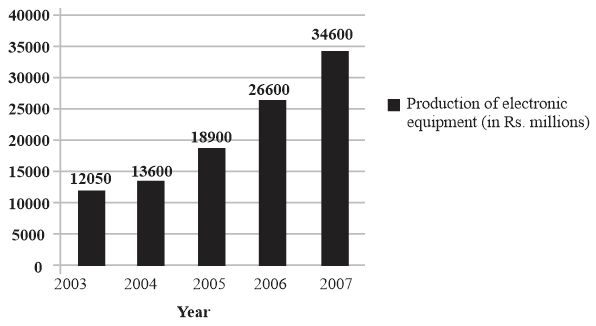
If the production of electronic equipment in is taken as base, the index of approximate production in is equal to_____.
Study the following graph carefully to answer the question that follow:
Number of applicants (in ) who applied for two different banks during past six years :
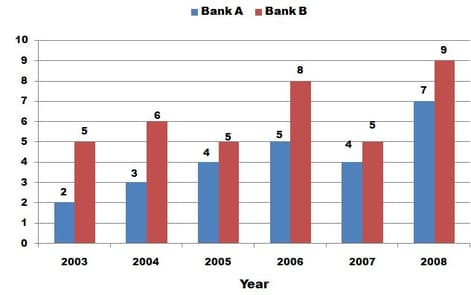
Total number of candidates who applied for Bank over all the years together was approximately what percentage of the total number of candidates who applied for Bank over all the years together?
Study the following graph and answer the question that follows:
Number of Candidates (in thousands) admitted in two different institutions
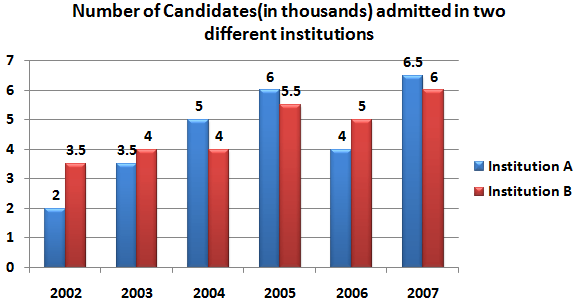
What was the total number of candidates admitted in Institution B over all the years together?
Directions: Study the Following bar graph given below shows the foreign exchange reserves of a country (in a million US) from to . Answer the questions based on graph:
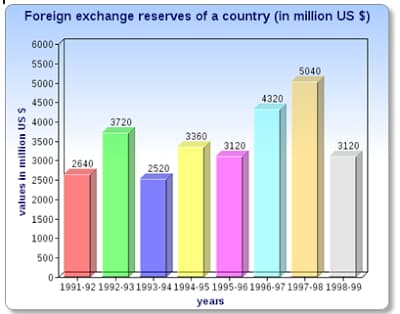
In over , how much of the percentage increase in the foreign exchange reserves ?
Study of bar graph and answer the questions.
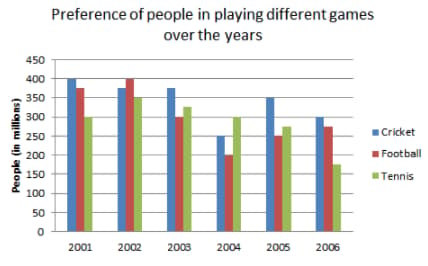
From , the total number of people who preferred to play football was what ?
Study the graph and answer
.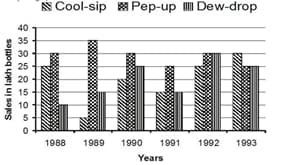
In which year the sale of cool-sip is minimum?
The sub-divided bar diagram given below depicts the result of B.Com. Students of a college for Study the graph and answer the questions.
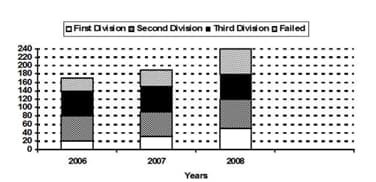
How many percent passed in the first division in ?
Study the following graph carefully and answer the following questions.
Demand and Production of colour T.V. of five companies for October 1988.
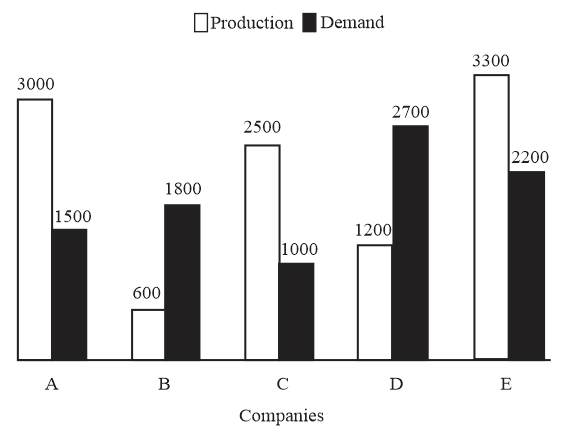
What is the difference between the demand of company B and that of company D?


